

Your free checklist for choosing the right builder
July 28, 2014
How to make investing in property more affordable each week
September 15, 2014Saving Money on Your Energy Bill

The cost of electricity continues to be a hot topic of conversation and is placing stress on many household budgets. In the last 10 to 12 years the average increase in electricity prices across Australia has been a staggering 134.5%. So if you are feeling the heat, you are not alone.
We’d like to help you identify a few key areas related to your household’s energy bill including:
- cost increases in recent years,
- the main areas of energy consumption in households across Australia, and
- the appliances that are costing you the most to run.
Increasing costs
Since 2006 prices have increased by the following percentages in Australian capital cities:
- Sydney – 89.2%
- Melbourne – 84.9%
- Brisbane – 71.6%
- Adelaide – 68.8%
- Hobart – 65.1%
- Perth – 56.9%
- Canberra – 50.8%
- Darwin – 45.7%
Source: www.essa.com.au /essa Fact Sheet/Electricity Price Growth
Why have prices increased?
• Increased network costs – Old energy infrastructure is being upgraded due to neglect from a lack of funds over past decades. Up to 80%[1] of price increases have been attributed to increased network charges, however as upgrades are completed prices should reach a stage of stabilisation.
• Environmental charges – Approximately 15% of each bill can be attributed to these charges. They include the carbon tax plus a whole raft of other state and federal environmental charges[2].
What facilities consume the most energy?
By understanding the areas of your household that consume the most energy, you can begin to take positive action to reduce the impact these bills have on your household budget. This chart identifies the general areas responsible for the greatest percentage of energy use:
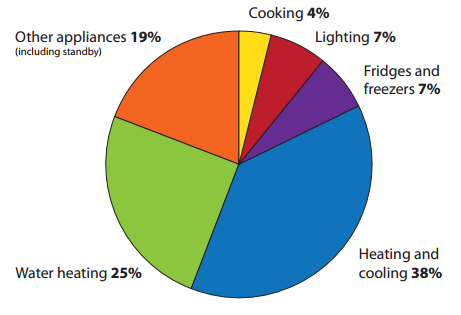
Some general tips to reduce costs for these areas are:
- Heating and cooling – Choose appropriate thermostat settings on your reverse cycle air conditioning (18-20C for winter heating and 24-26oC for summer cooling). Each degree extra will increase energy consumption by about 5-10%.
- Water heating – A short (4 minute) shower is a good shower! Did you know switching from a high flow inefficient showerhead to a 3 star rated showerhead can reduce your use by half? And remember to turn your hot water service off if you are going away.
- Laundry appliances – Wash in cold water and wait until you have a full load. Try to minimise clothes dryer usage – drying in the sun is free!
Which appliances are costing you the most?
To really drive home the impact energy costs have on your household budget it is useful to look at what your appliances are costing you in real terms. We’ve listed the average cost per quarter* for some below [3]:
- Ducted air conditioning – $216
- Wall mounted air conditioning – $134
- Electric hot water unit – $150
- Plasma TV (130cm-165cm) – $49 to $134
- Large LCD TV (90cm-183cm) – $23 to $96
- Fridge/freezer 500 litre – $45
- Clothes dryer (just one cycle per week!) – $6 to $34
*General estimates only. Model, age, wattage and usage rates can influence running costs. Estimates are based on 30¢ per kWh for electricity (peak)
If you have a swimming pool this will typically use around 2,000kWh-3,000kWh of electricity per year with running costs between $800 and $1,200 pa dependent on the type and size of pump, how long it is run and whether it is heated.
While you can’t avoid today’s higher costs it certainly helps if you can identify your major usage so you can take steps to minimise these areas. You can also save money on your energy bill by choosing a cheaper provider or asking your existing provider for a better deal. There are plenty of free comparison sites available to help you compare costs.
Consider paying your energy bill in monthly, fortnightly or weekly instalments to help you manage your budget and avoid the angst that comes with a large quarterly bill. Some providers also offer loyalty and/or ‘pay on time’ discounts.
- www.ipart.nsw.gov.au/…/Final_Report_-_Review_of_regulated_retail_tarrifs_and_charges_for_electricity.
- Data source: IPART Fact Sheet 13 June 2012, The impact of green schemes on regulated retail prices from 1 July 2012.
- Data source: IPART Fact Sheet 13 June 2012, The impact of green schemes on regulated retail prices from 1 July 2012.


